Graphs
Graph is a kind of indicator in data analysis and they can be used in different purposes in every sectors.
- Statistics related fields like reserches
- Bussiness Indistry to analysis the product progress and the econmical growth
- Some conceptuals tasks in every industry(Medical, Education, Weather, Agriculture, etc.)
Line Diagrams
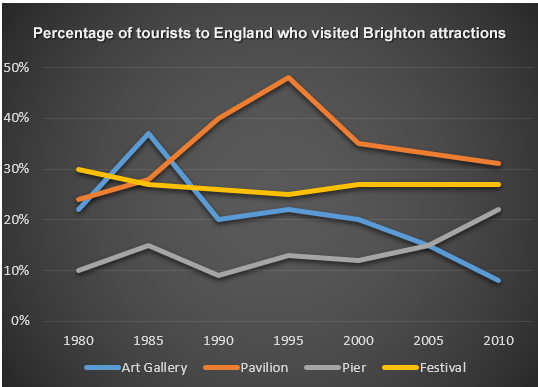
The line graph shows the percentage of tourists to England who visited certain Brighton attractions between
1980 and 2010. We can see that in 1980 and in 2010 the favourite attractions were the pavilion and the festival.
During the 1980s and 1990s there was a sharp increase in visitors to the pavilion from 28% to
48% and then the percentage gradually went down to 31% in 2010. |