Graphs
Graph is a kind of indicator in data analysis and they can be used in different purposes in every sectors.
- Statistics related fields like reserches
- Bussiness Indistry to analysis the product progress and the econmical growth
- Some conceptuals tasks in every industry(Medical, Education, Weather, Agriculture, etc.)
Pie Chart
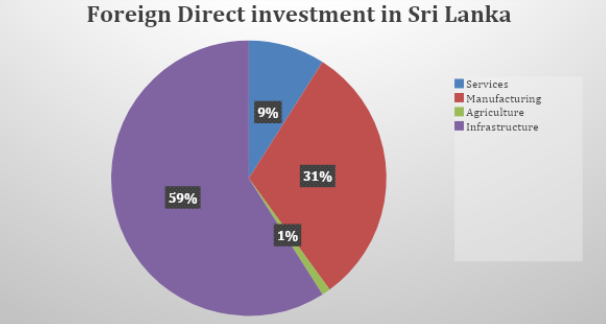
The pie chart depicts/represents the Foreign direct investment in Sri Lanka in 2010 in services, manufacturing, agriculture and infrastructure sectors according to the Central Bank report. Where the investment in the year 2020 is concerned 59% of the total
investment has been made on infrastructure development while investment in manufacturing has taken 31%. This chart also makes it clear that Sri Lanka is still at the primary level of development because the
expenditure on infrastructure development is twice as big as the expenditure on manufacturing. |