Graphs
Graph is a kind of indicator in data analysis and they can be used in different purposes in every sectors.
- Statistics related fields like reserches
- Bussiness Indistry to analysis the product progress and the econmical growth
- Some conceptuals tasks in every industry(Medical, Education, Weather, Agriculture, etc.)
Bar Charts
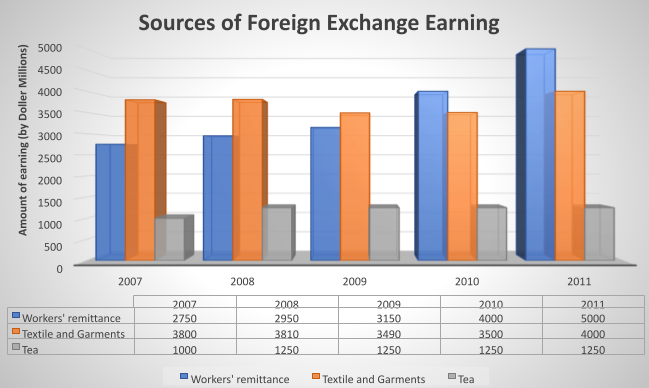
The bar chart represents/depicts three different sources of foreign exchange earnings from
2007-2011 respectively. In 2007 tea has drawn a foreign exchange of 1000$ million. In conclusion, we can see that the industry in Sri Lanka has not developed considerably and it doesn’t show a greater growth income over the years. While textile and garments show a slight increase, worker’s remittance has become the main source of foreign exchange earning in Sri Lanka by 2011. |